 Footballscience.net

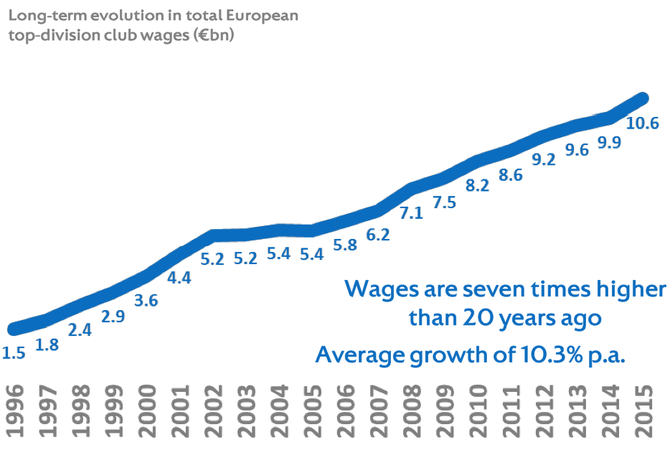
Chapter 9 of the European club footballing landscape was about squad cost and wages
Generally, wages absorbed 63% of the club’s revenue in 2015.
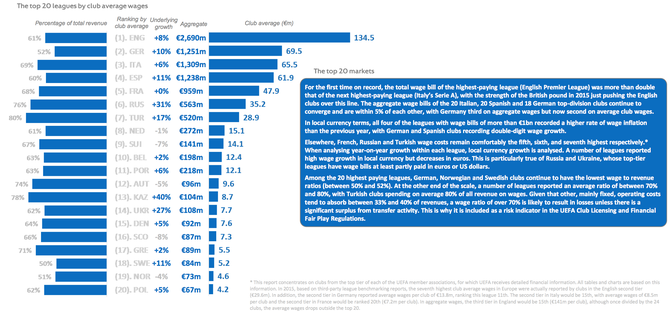
A country comparison shows that the English Premier League clubs had more than double the next highest league (Italy’s Serie A) wages. Only Germany, Norway and Sweden have a wage to revenue ratio below 60%. Clubs in Turkey spend 80% of their revenue on wages.
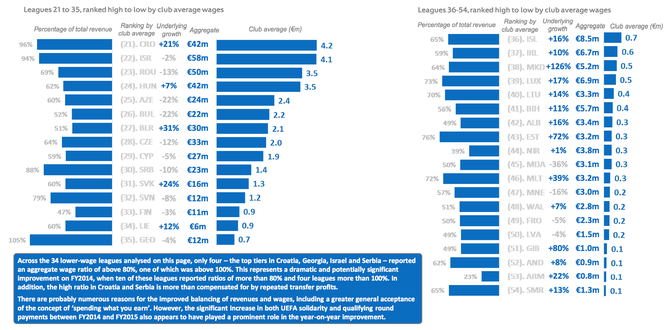
Outside the Top 20 league, Finnland spend only 47% of revenue on wages, while clubs in Georgia spend 105%.
Making a closer look on the club inside the top 20 league you will find the usual clubs, with Barca and Real sitting at the top spending 340 and 289 mio Euros in wages, which equals 61 and 50% of the revenue and 5.5 and 4.7 times the Spanish league average respectively.
A total of 24 clubs had a wage bill in excess of 100 mio Euros and 9 clubs exceeding 200 mio.

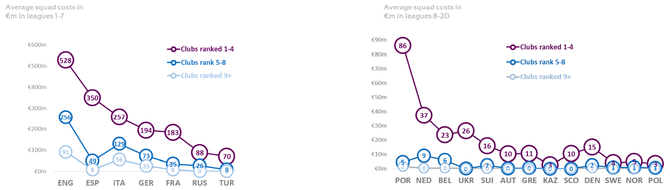
Interestingly, an analysis of teams clustered in a) clubs ranked 1-4, b) ranked 5-8 and c) ranked 9+ indicates that due to the massive English Premier League TV deal, the English teams ranked 5-8 paid more in wages (144 mio) than clubs ranked 1-4 in France (128 mio), Russia (72 mio) and Turkey (70 mio). Furthermore, the EPL teams 9+ paid more in wages (86) than any other league teams ranked 5-8 (<74 mio in Germany).
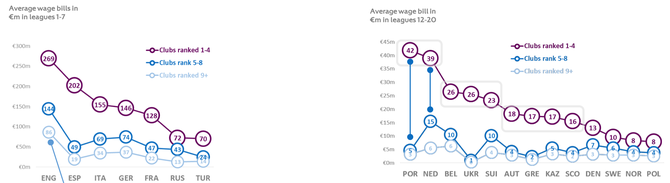
Another interesting fact is that clubs ranked 1-4 in Portugal (42 mio) and Netherlands (39 mio) have a more than a 50% gap to the clubs ranked 5-8. There seems no doubt as to why there are (most likely) the same league winner over time.
Taking the transfer cost of squad into account, England (528 mio) showed again the greatest budget, followed by Spain (350 mio), Italy (257 mio), Germany (194) and France (183) for the teams ranked 1-4. Again, teams in England ranked 5-8 “outcost” teams ranked 1-4 in Germany, France, Russia and Turkey by more than 60 mio Euros. Interestingly, the average costs of Spains second cluster (teams 5-8 = 49 mio) seems very low compared to the equivalent to England (256 mio), Italy (129 mio), Germany (73 mio) and the third cluster (team ranked 9+) in England (91 mio). The document mentioned that the situation was driven by changes in the regulatory environment with a need to balance finances.
Outside the top 8 leagues, Portugal had the greatest squad costs with 86 mio, followed by Netherlands (37 mio) and Belgium (23 mio).
The question arises if a more precise measurement would be the squad costs to wages ratio. There seems to be a strong correlation (r=089) between wages and transfer fees. However, Barca has a relatively high wage bill, however a “low” squad spend, while Liverpool and Inter had low wage bills relative to their squad costs.
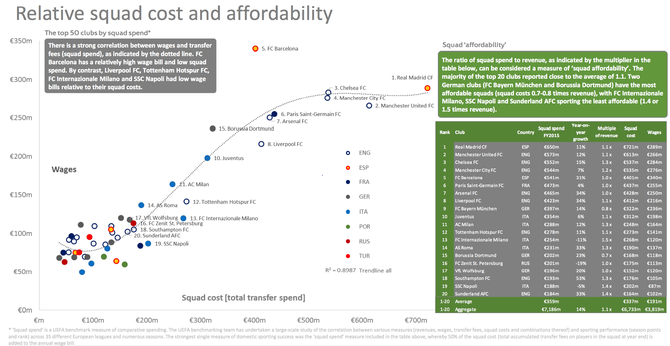
Squad affordability is a ratio of squad expenses to the clubs revenue, indicating that only the German clubs in the Top 20 are under a ratio of 1.0. Inter has the worst ratio of 1.5 having squad costs of 268 mio against wages of 120 mio. Real and ManU comfortably sitting in first and second place with 650 and 573 mio squad expenses respectively.
Reference
http://www.uefa.org/MultimediaFiles/Download/Tech/uefaorg/General/02/42/27/91/2422791_DOWNLOAD.pdf
